Sterling Jumps Near March Highs as Oil Shock Eases
GBP/USD jumped as a sharp pullback in oil prices and signs of Iran de-escalation lifted sentiment, easing pressure on the U.K. outlook and complicating the BOE’s policy path.

GBP/USD rallied meaningfully throughout Monday as markets reacted to a sudden shift in the geopolitical backdrop, with reports of delayed U.S. strikes on Iranian energy infrastructure triggering a sharp drop in oil prices and a broader risk-on move. The decline in Brent oil eased immediate concerns about an energy-driven inflation spike in the U.K., a key vulnerability given its reliance on imported fuel. That shift improved the relative outlook for the U.K. economy and supported Sterling, while the U.S. Dollar softened as safe-haven liquidity demand unwound alongside stabilizing global sentiment.
For the BOE, the move lower in energy prices introduces a new layer of uncertainty. Just days ago, the oil shock had raised the risk of renewed inflation and a more hawkish policy stance, but today’s reversal reopens the possibility that inflation pressures may prove less persistent. Policymakers are now left navigating a rapidly changing environment, balancing still-elevated price risks against a fragile growth backdrop. With the Federal Reserve maintaining a steady stance and the U.S. outlook holding firm, GBP/USD’s rally reflects a recalibration of relative risk rather than a fundamental shift in the longer-term policy divergence.
GBP/USD Daily Price History
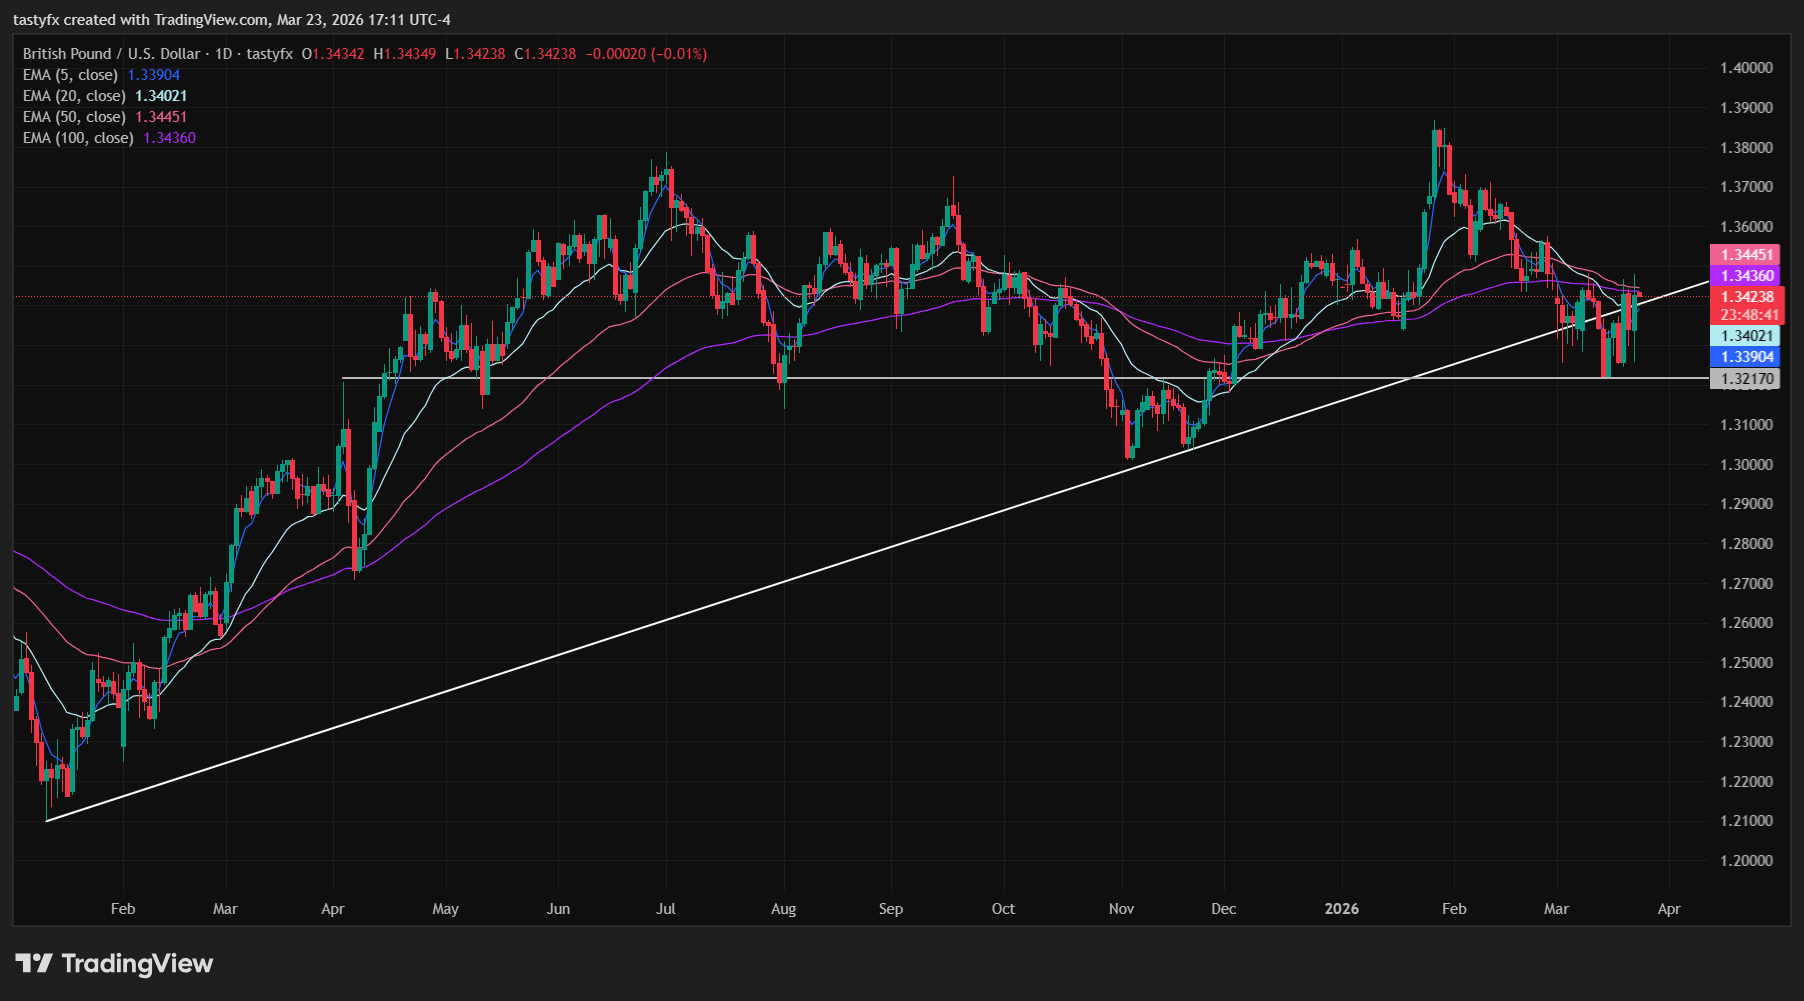
In the above chart, GBP/USD is trying to climb back into the uptrend from the January and November 2025 lows. However, it has been ensnared by a cluster of moving averages, as each of the daily 50-, and 100 EMAs (exponential moving average) proved as resistance during today’s session – not dissimilar to how they’ve served as resistance throughout March. A move above 1.3483 would establish a new high for the month, signaling an end to the series of lower highs and lower lows since late January (and likewise produce the needed breach of the daily 50- and 100-EMAs). Until then, traders new to GBP/USD may see a range between 1.3217 and 1.3483 that is either a bear flag or a bottom (inverse head and shoulders on 1-hour and 4-hour timeframes) being carved out.
Trading forex requires an account with a forex provider like tastyfx. It’s important to manage your risks carefully as losses can exceed your deposit. Ensure you understand the risks and benefits associated with trading leveraged products before you start trading with them.