Japanese Yen Rips as BOJ Hike Bets Build
USD/JPY fell as stronger Japanese wage data, upgraded GDP, and rising BOJ hike expectations forced another unwind in carry trades.


USD/JPY traded lower as U.S. trading resumed on Tuesday as the Japanese Yen extended its sharp rally, briefly strengthening to its best level since February before giving back part of the move later in the session. The catalyst? Domestic Japanese data: real wages rose 2.4% year-over-year in July, the strongest gain since 2021; and second-quarter GDP was revised up to a 1.4% annualized pace. That gave markets more confidence that the Bank of Japan has enough cover to raise rates again at the September 17-18 meeting, with traders pricing in 97% chance of a 25-basis-point hike to 1.25%, per Japan overnight index swaps.
The U.S. side is keeping the move from becoming a straight-line collapse in USD/JPY. Friday’s stronger payrolls report kept September Fed hike odds alive near 60%, and this week’s U.S. inflation data can still reset the U.S. Dollar quickly. Intervention risk remains in the background after the summer’s Yen-buying operations, but today’s move looked more like carry-trade stress and BOJ repricing than fresh official action. Rate checks and MOF warnings can still hit the tape if price action gets disorderly, but the Japanese Yen finally has a cleaner fundamental driver, at least through the end of next week: wages, growth, and a BOJ that may be ready to move again.
USD/JPY Daily Price History
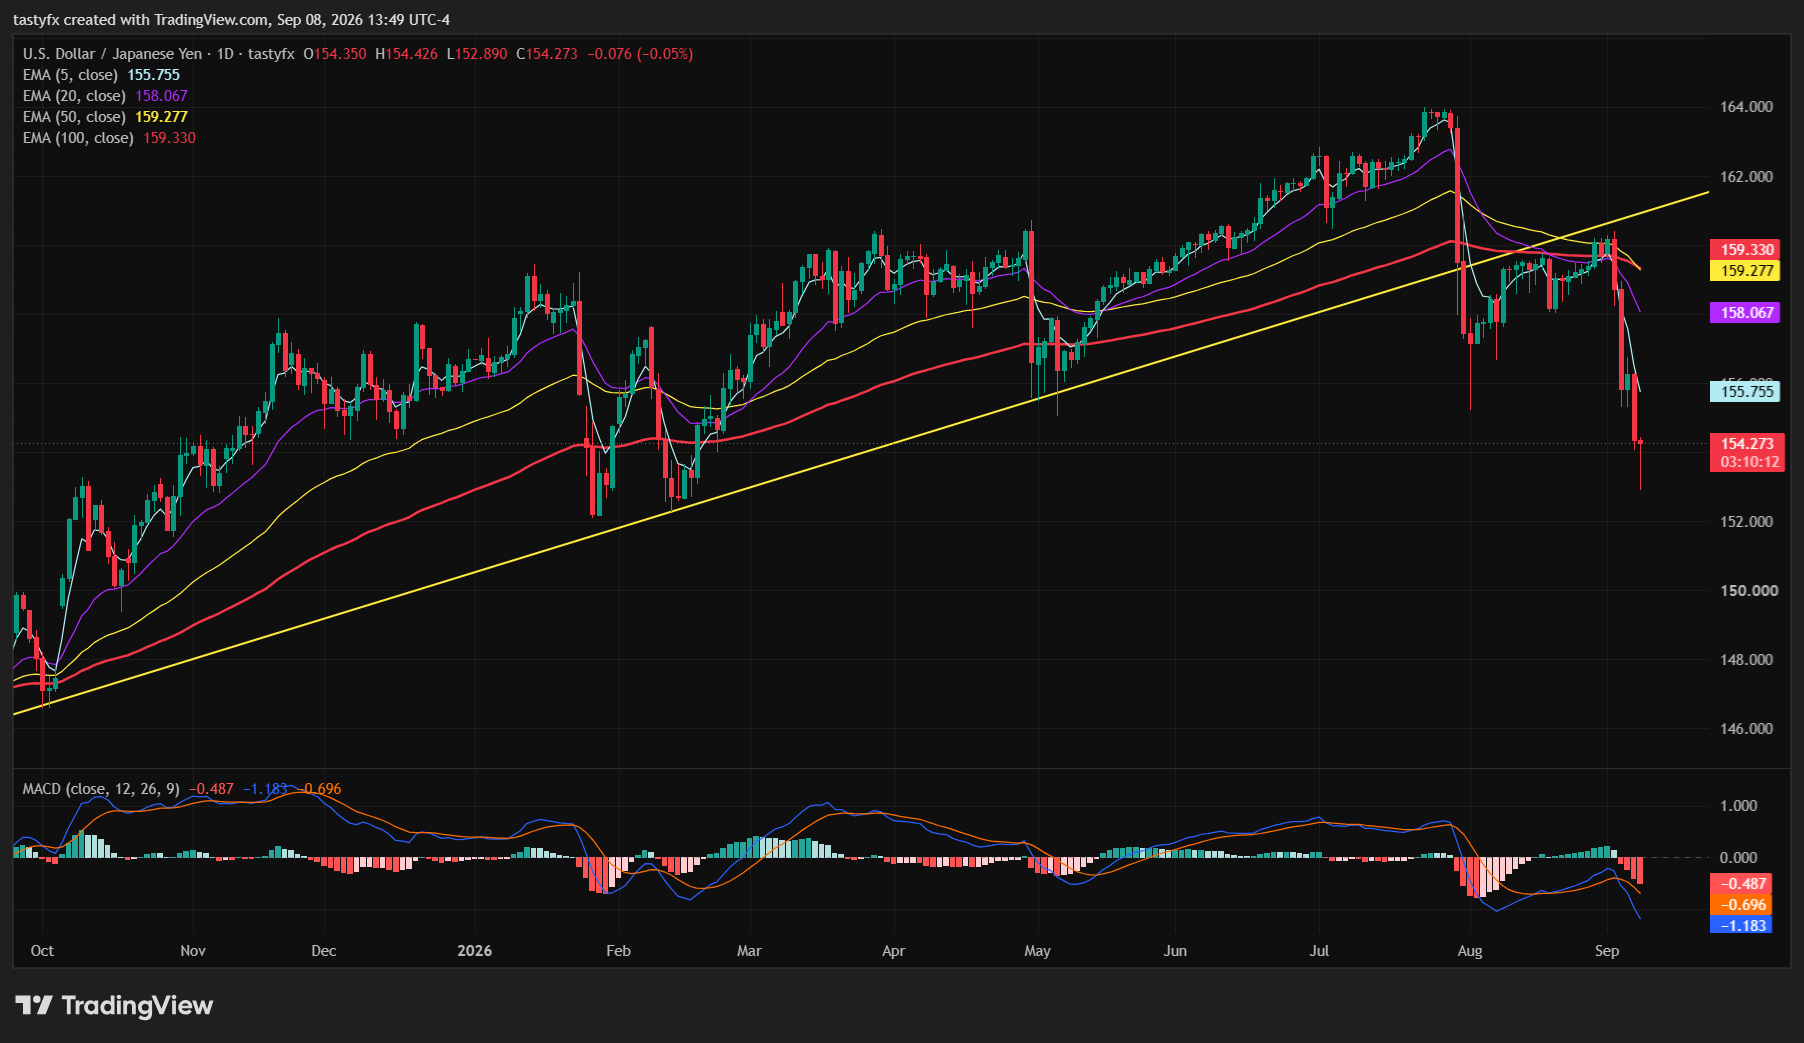
USD/JPY has broken trend support, losing the rising trendline that carried the entire advance from the April 2025 low. The pair has since sliced through the moving-average cluster and is now sitting below the 155.00 shelf that had been the key support zone since the summer intervention scare. The chart’s structure has evolved, from controlled uptrend to downside momentum with failed rebounds likely to get sold.
A clean bearish setup could be selling failed rebounds into 155.00-156.50. That zone is now the first major test. Momentum confirms the damage. MACD has rolled over below the zero line with red histogram expanding, and stochastics are buried near oversold. The pair is stretched short term, so a snapback is possible, but the broader message is clear: the Japanese Yen has taken control and the U.S. Dollar has lost the rate-driven trend support. If USD/JPY cannot reclaim it quickly, sellers could stay in control and the next downside levels are 152.00, then 150.00-150.50. A move into that area would mark a full reset of the summer breakout.
Trading forex requires an account with a forex provider like tastyfx. It’s important to manage your risks carefully as losses can exceed your deposit. Ensure you understand the risks and benefits associated with trading leveraged products before you start trading with them.