Are these the 8 best volatility indicators traders should know?

What are volatility indicators?
Volatility indicators are technical tools that help traders and analysts measure and understand the periods of high and low volatility in a particular forex pair, or the FX market as a whole. When selecting a forex pair, traders often look at its historical volatility or its implied volatility to help determine the risks associated with it.
It can be important to understand the different volatility indicators and how to use them when attempting to make more informed trading decisions.
How to identify volatility in the forex market
You can calculate standard deviations of forex pairs on our platform by adding the ‘Standard Deviation’ indicator to a chart.
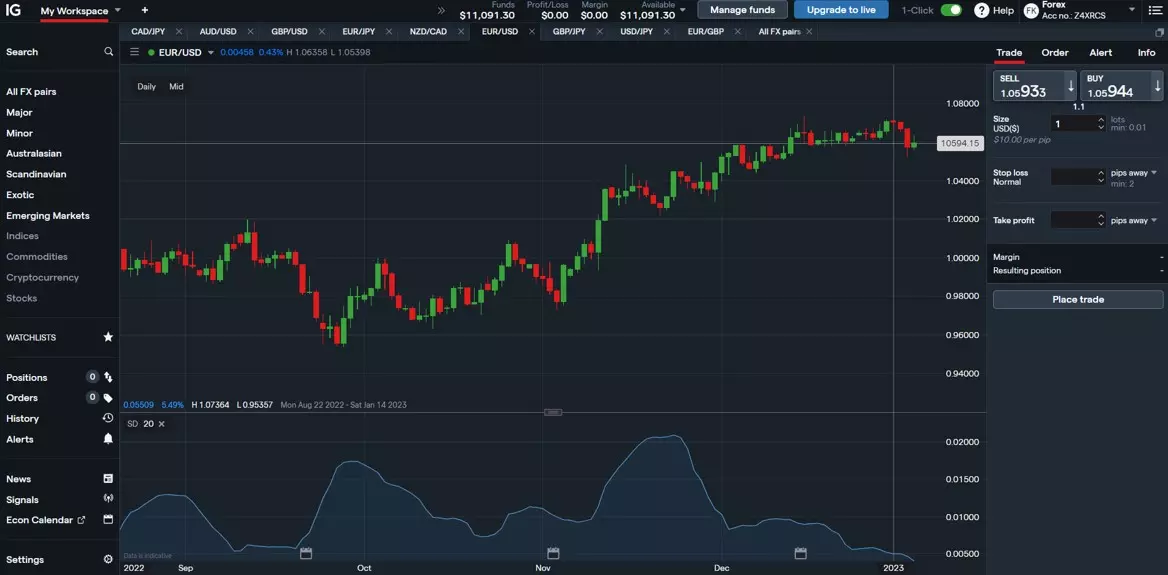
Volatility is often placed into two categories:
- Low volatility – a security’s value doesn’t fluctuate dramatically and tends to be more steady
- High volatility – a security’s value can change dramatically over a short period of time in either direction
Different market conditions call for various strategies. While periods of low volatility could be appropriate for a more laid-back trading style, periods of high volatility could be beneficial for breakout strategies and scalping.
Volatility can be driven by macroeconomic events, human psychology or factors unique to one sector. Understanding general market conditions can inform your forex trading decisions – the indicators below can help you identify volatility in the FX market.
How to use volatility indicators in trading
- Learn more about the best volatility indicators
- Pick the pair you want to trade
- Open an account or log in
- Take steps to manage your risk
- Place your trade
Bollinger Bands
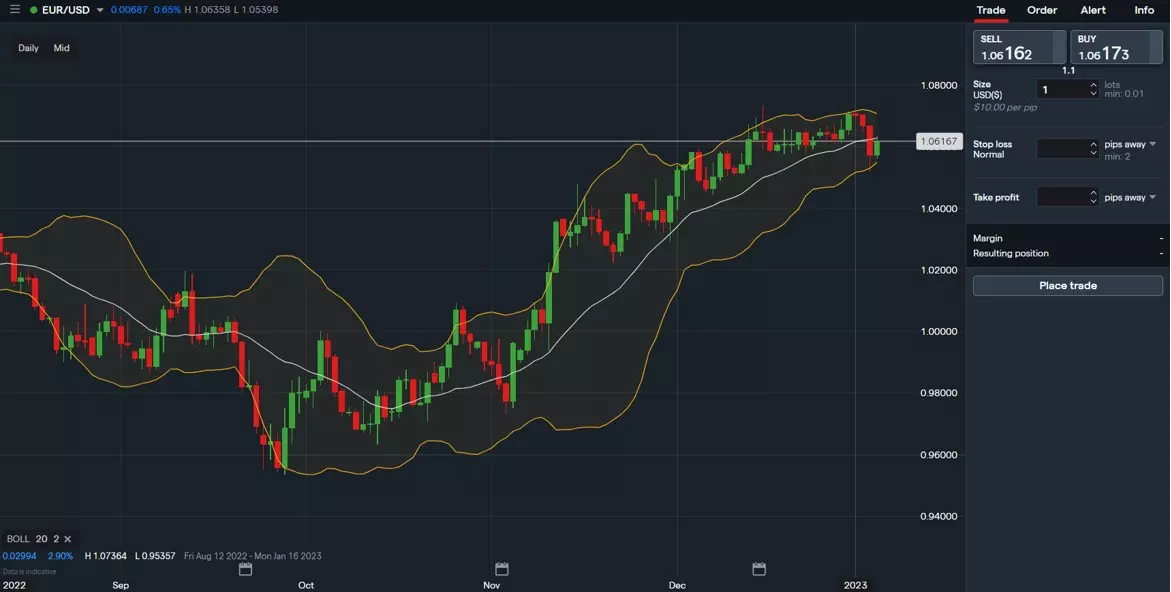
Bollinger Bands are a prominent type of technical price indicator. An upper and lower band, placed on either side of a simple moving average (SMA), make up their structure. Each band can be used to identify regions of support and resistance because it is plotted two standard deviations from the market's SMA.
Our trading platform automatically calculates Bollinger Bands for you, but it is still useful for a trader to know what the different bands mean and what can be learned from them.
ATR – Average True Range indicator
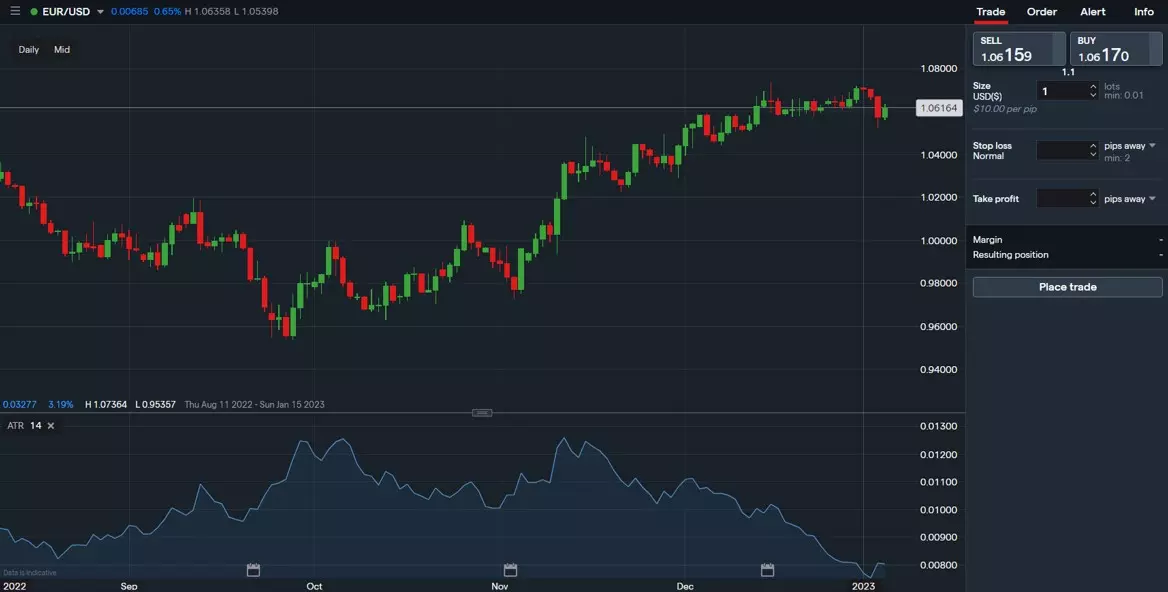
The Average True Range (ATR) indicator is used to track volatility over a given period of time. It moves upward or downward based on how pronounced price changes are for an FX pair, with a higher ATR value indicating greater market volatility and a lower ATR indicating lower market volatility.
How to calculate the average true range
To calculate the average true range, you first need to calculate the true range. You do this by taking the largest of these three calculations:
- The absolute value of the current high minus the previous close
- The absolute value of the current low minus the previous close
- The current high minus the current low
You’d repeat this process over a specific timeframe to get a moving average of a series of true ranges.
VIX – Volatility Index
The VIX is a real-time volatility index, created by the Chicago Board Options Exchange (CBOE). However, because the index is forward-looking, it only displays the implied volatility of the S&P 500 (SPX) for the next 30 days.
The overall volatility of the S&P 500 is used as an indicator of general market sentiment and could influence the FX market, too.
The VIX is derived as a percentage using the pricing of SPX index options. The S&P 500 is most likely experiencing a decline if the VIX value rises, whereas a decline in the VIX value indicates that the index is likely to be stable.
Keltner channel indicator
The Keltner channel indicator looks for areas of price volatility in a currency pair. It uses three independent lines to assess the pair’s volatility based on price movement and support or resistance levels.
If the price closes above the upper band, which represents resistance, or below the lower band, which represents support, it may indicate that the trend will either change or pick up speed.
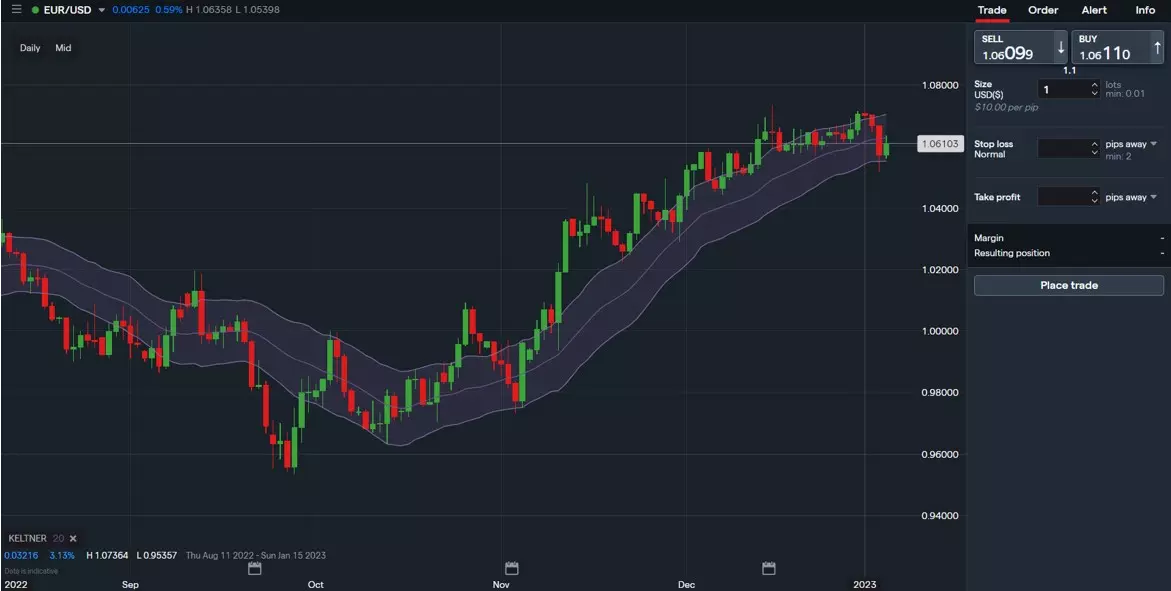
You can automatically calculate the Keltner channel on our forex trading platform.
Donchian channel indicator
The Donchian channel indicator is used by traders to spot possible breakouts and retracements, clearly map the information provided by the channel and allow for swift action on any future trade indications.
The price graph below gives an example of what Donchian channel indicators look like when set over a candlestick chart. The middle band reflects an average of the current high and the current low for that trading session, while the upper and lower bands represent the highest high and lowest low of the prior period, respectively.
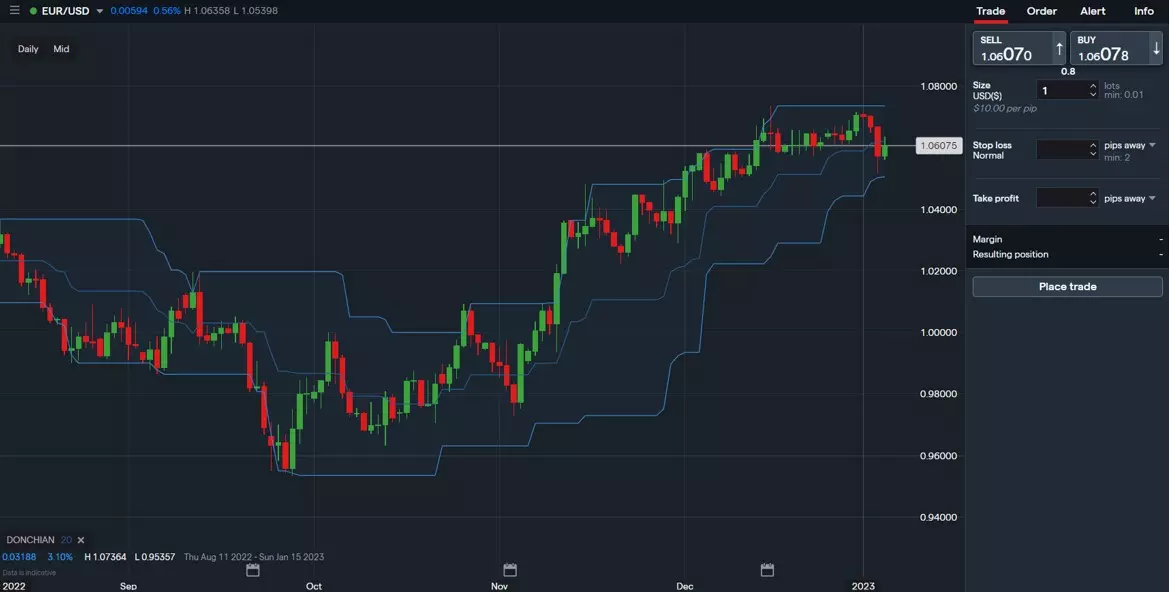
You can calculate the Donchian channel indicator at the click of a button on our trading platform.
Chaikin volatility indicator
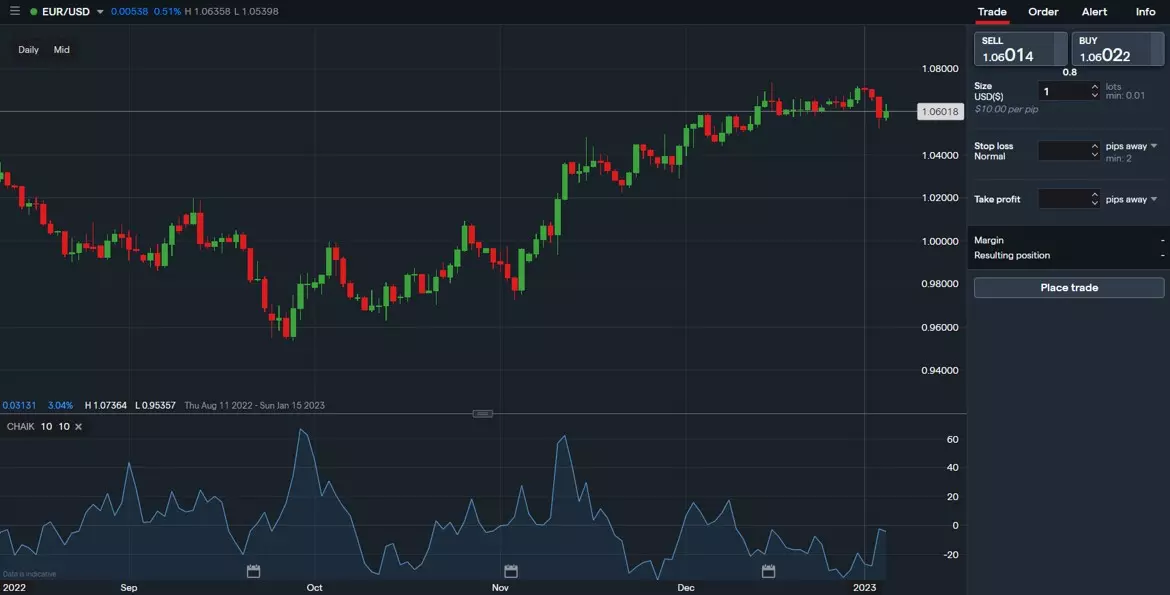
The Chaikin volatility indicator demonstrates the difference between two volume-weighted accumulation-distribution lines' moving averages. Volatility is measured as a widening of the range between a currency pair's high and low price by comparing the gap between those two prices. An increase in the volatility indicator over a brief period can suggest that a bottom is nearby. An impending top may be indicated by a longer-term decline in volatility. The Chaikin indicator can be used in conjunction with a moving average system or price envelope.
Twiggs volatility indicator
The Twiggs volatility indicator is used to signal increased market risk. It’s usually applied to market indices but may also be useful in tracking the behavior of individual forex pairs.
Twiggs volatility is mostly used to indicate rising and falling market risk, where:
- Rising troughs show an increase in market risk
- Peaks that are descending show a decrease in market risk
Relative Volatility Index (RVI)
Relative Volatility Index (RVI) was developed by Donald Dorsey, and it calculates the direction of the volatility of an asset’s price. The RVI can range from zero to 100 and help to measure how strong or weak a market has been performing.
RVI buy and sell signals
Below are the rules that Dorsey developed for buying and selling signals when using the RVI:
- Buy if RVI is greater than 50
- Sell if RVI is less than 50
- If you miss the first RVI buy signal, buy when RVI is greater than 60
- If you miss the first RVI sell signal, sell when RVI is less than 40
- Close a long position when the RVI falls below 40
- Close a short position when the RVI rises above 60
This RVI isn’t meant to be used as a standalone indicator for trading and should be used in conjunction with other trading tools and methodologies. RVI is a backward-looking measure and is not indicative of future results when trading forex.
Top 8 volatility indicators summed up
- Volatility indicators are technical tools that help traders and analysts measure and understand the periods of high and low volatility in a particular forex pair or the market as a whole
- Many traders and analysts use standard deviation as their primary measure of volatility
- Volatility is often placed into two categories of risk – low and high risk
- You can trade volatility in the forex market with us using leverage
Note that these aren’t necessarily the best indicators by any specific measure and using them doesn’t guarantee a positive outcome on your trades. The indicators chosen are some of the most useful and popular among traders when it comes to measuring volatility.
This information has been prepared by tastyfx, a trading name of tastyfx LLC. This material does not contain a record of our trading prices, or an offer of, or solicitation for, a transaction in any financial instrument. You should not treat any opinion expressed in this material as a specific inducement to make any investment or follow any strategy, but only as an expression of opinion. This material does not consider your investment objectives, financial situation or needs and is not intended as recommendations appropriate for you. No representation or warranty is given as to the accuracy or completeness of the above information. tastyfx accepts no responsibility for any use that may be made of these comments and for any consequences that result. See our Summary Conflicts Policy, available on our website.
