How to trade using the inverted hammer candlestick pattern
Knowing how to spot possible reversals when trading can help you maximize your opportunities. The inverted hammer candlestick pattern is one such a signal that can help you identify new trends. Learn more about it in this guide.

What is the inverted hammer candlestick pattern?
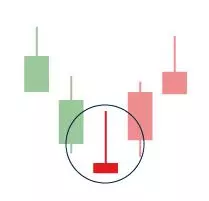
The inverted hammer candlestick pattern (or inverse hammer) is a candlestick that appears on a chart when there is pressure from buyers to push an asset’s price up. It often appears at the bottom of a downtrend, signaling potential bullish reversal.
The inverted hammer pattern gets its name from its shape – it looks like an upside-down hammer. To identify an inverted hammer candle, look out for a long upper wick, a short lower wick and a small body.
How is an inverted hammer candlestick formed?
An inverted hammer candlestick is formed when bullish traders start to gain confidence. The top part of the wick is formed when bulls push the price up as far as they can, while the lower part of the wick is caused by bears (or short-sellers) trying to resist the higher price. However, the bullish trend is too strong, and the market settles at a higher price.

What does an inverted hammer tell traders?
An inverted hammer tells traders that buyers are putting pressure on the market. It warns that there could be a price reversal following a bearish trend. It’s important to remember that the inverted hammer candlestick shouldn’t be viewed in isolation – always confirm any possible signals with additional formations or technical indicators. Lastly, consult your trading plan before acting on the inverted hammer.
How to trade when you see the inverted hammer candlestick pattern
To trade when you see the inverted hammer candlestick pattern, start by looking for other signals that confirm the possible reversal. To trade an uptrend, you can ‘buy’ (go long). If you think that the signal is not strong enough and the downtrend will continue, you can ‘sell’ (go short).
If you have a live tastyfx trading account, you can follow these steps to trade when you see the inverted hammer candlestick pattern:
- Log in to your trading account
- Search the asset you want to trade in the ‘finder’ panel
- Input your position size
- Choose ‘buy’ or ‘sell’ in the deal ticket
- Confirm the trade
You can also practice finding the inverted hammer and placing trades on a risk-free tastyfx demo account.
Inverted hammer candlestick pattern summed up
- The inverted hammer candlestick appears on a chart when there is pressure from buyers, signaling a possible bullish reversal
- To identify an inverted hammer candle, look out for a long upper wick, a short lower wick and a small body
- An inverted hammer tells traders that buyers are gaining confidence in the market
- With derivatives, you can trade rising or falling prices because you do not own the underlying asset
This information has been prepared by tastyfx, a trading name of tastyfx LLC. This material does not contain a record of our trading prices, or an offer of, or solicitation for, a transaction in any financial instrument. You should not treat any opinion expressed in this material as a specific inducement to make any investment or follow any strategy, but only as an expression of opinion. This material does not consider your investment objectives, financial situation or needs and is not intended as recommendations appropriate for you. No representation or warranty is given as to the accuracy or completeness of the above information. tastyfx accepts no responsibility for any use that may be made of these comments and for any consequences that result. See our Summary Conflicts Policy, available on our website.
