Why Support and Resistance Levels Are So Important In Forex Trading
Key support and resistance levels can shape forex price action, from reversals around familiar areas to sharper moves when those levels break.


Key points
- Support and resistance are price areas where buying or selling pressure has previously been strong enough to slow, stop, reverse, or accelerate a move.
- These areas often draw attention because they provide common reference points across the forex market, which can cause trading decisions and orders to concentrate around them.
- When a key level breaks, stop-loss orders positioned beyond the area can trigger and add to the move, while changing liquidity and new market information can further increase volatility.
Support and resistance are among the most widely used tools in forex trading. At a basic level, they identify price areas where buying or selling pressure has previously been strong enough to influence how the market moves.
That can show up in several ways. A currency pair may bounce from a prior low, stall near an earlier high, or accelerate once it breaks through a widely watched area. These levels can draw added attention because they provide visible reference points across the market.
The forex market brings together participants with very different objectives. Banks and corporations may be managing currency exposure, while hedge funds, algorithms, and individual traders may be seeking returns or responding to shorter-term market signals. Despite those differences, many participants still focus on the same widely watched price areas. That shared attention can concentrate profit-taking, new orders, and stop-loss activity around well-known market levels.
Support and resistance can help traders identify price areas where market activity may become more concentrated and where buying or selling pressure may begin to change how a currency pair is moving.
Today, we’ll look at the market mechanics behind support and resistance in forex: why certain price areas become focal points for trading activity, why volatility can increase when those areas break, and how traders can develop a more structured process for evaluating them.
The Forex Market Doesn't Have a Central Order Book
The foreign exchange market is enormous. Average daily FX turnover exceeded $9.5 trillion in April 20251, including about $3 trillion per day in spot transactions.
Unlike stocks or futures traded on centralized exchanges, foreign exchange is an over-the-counter (OTC) market. Banks, institutions, corporations, brokers, and other participants trade through a broad network of dealers, venues, and counterparties rather than through one central marketplace.
That means no single order book shows every buy order, sell order, or stop across the global spot market. There is also no consolidated real-time volume figure capturing all spot FX activity. A bank, broker, or trading venue may have a detailed view of its own order flow, but only a partial view of the broader market.
Widely recognized price areas can therefore provide useful reference points. Previous highs and lows, session ranges, round numbers, and other visible levels give market participants common areas to watch and can offer clues about where buying and selling interest may be concentrated.
Orders Tend to Cluster Around Key Levels
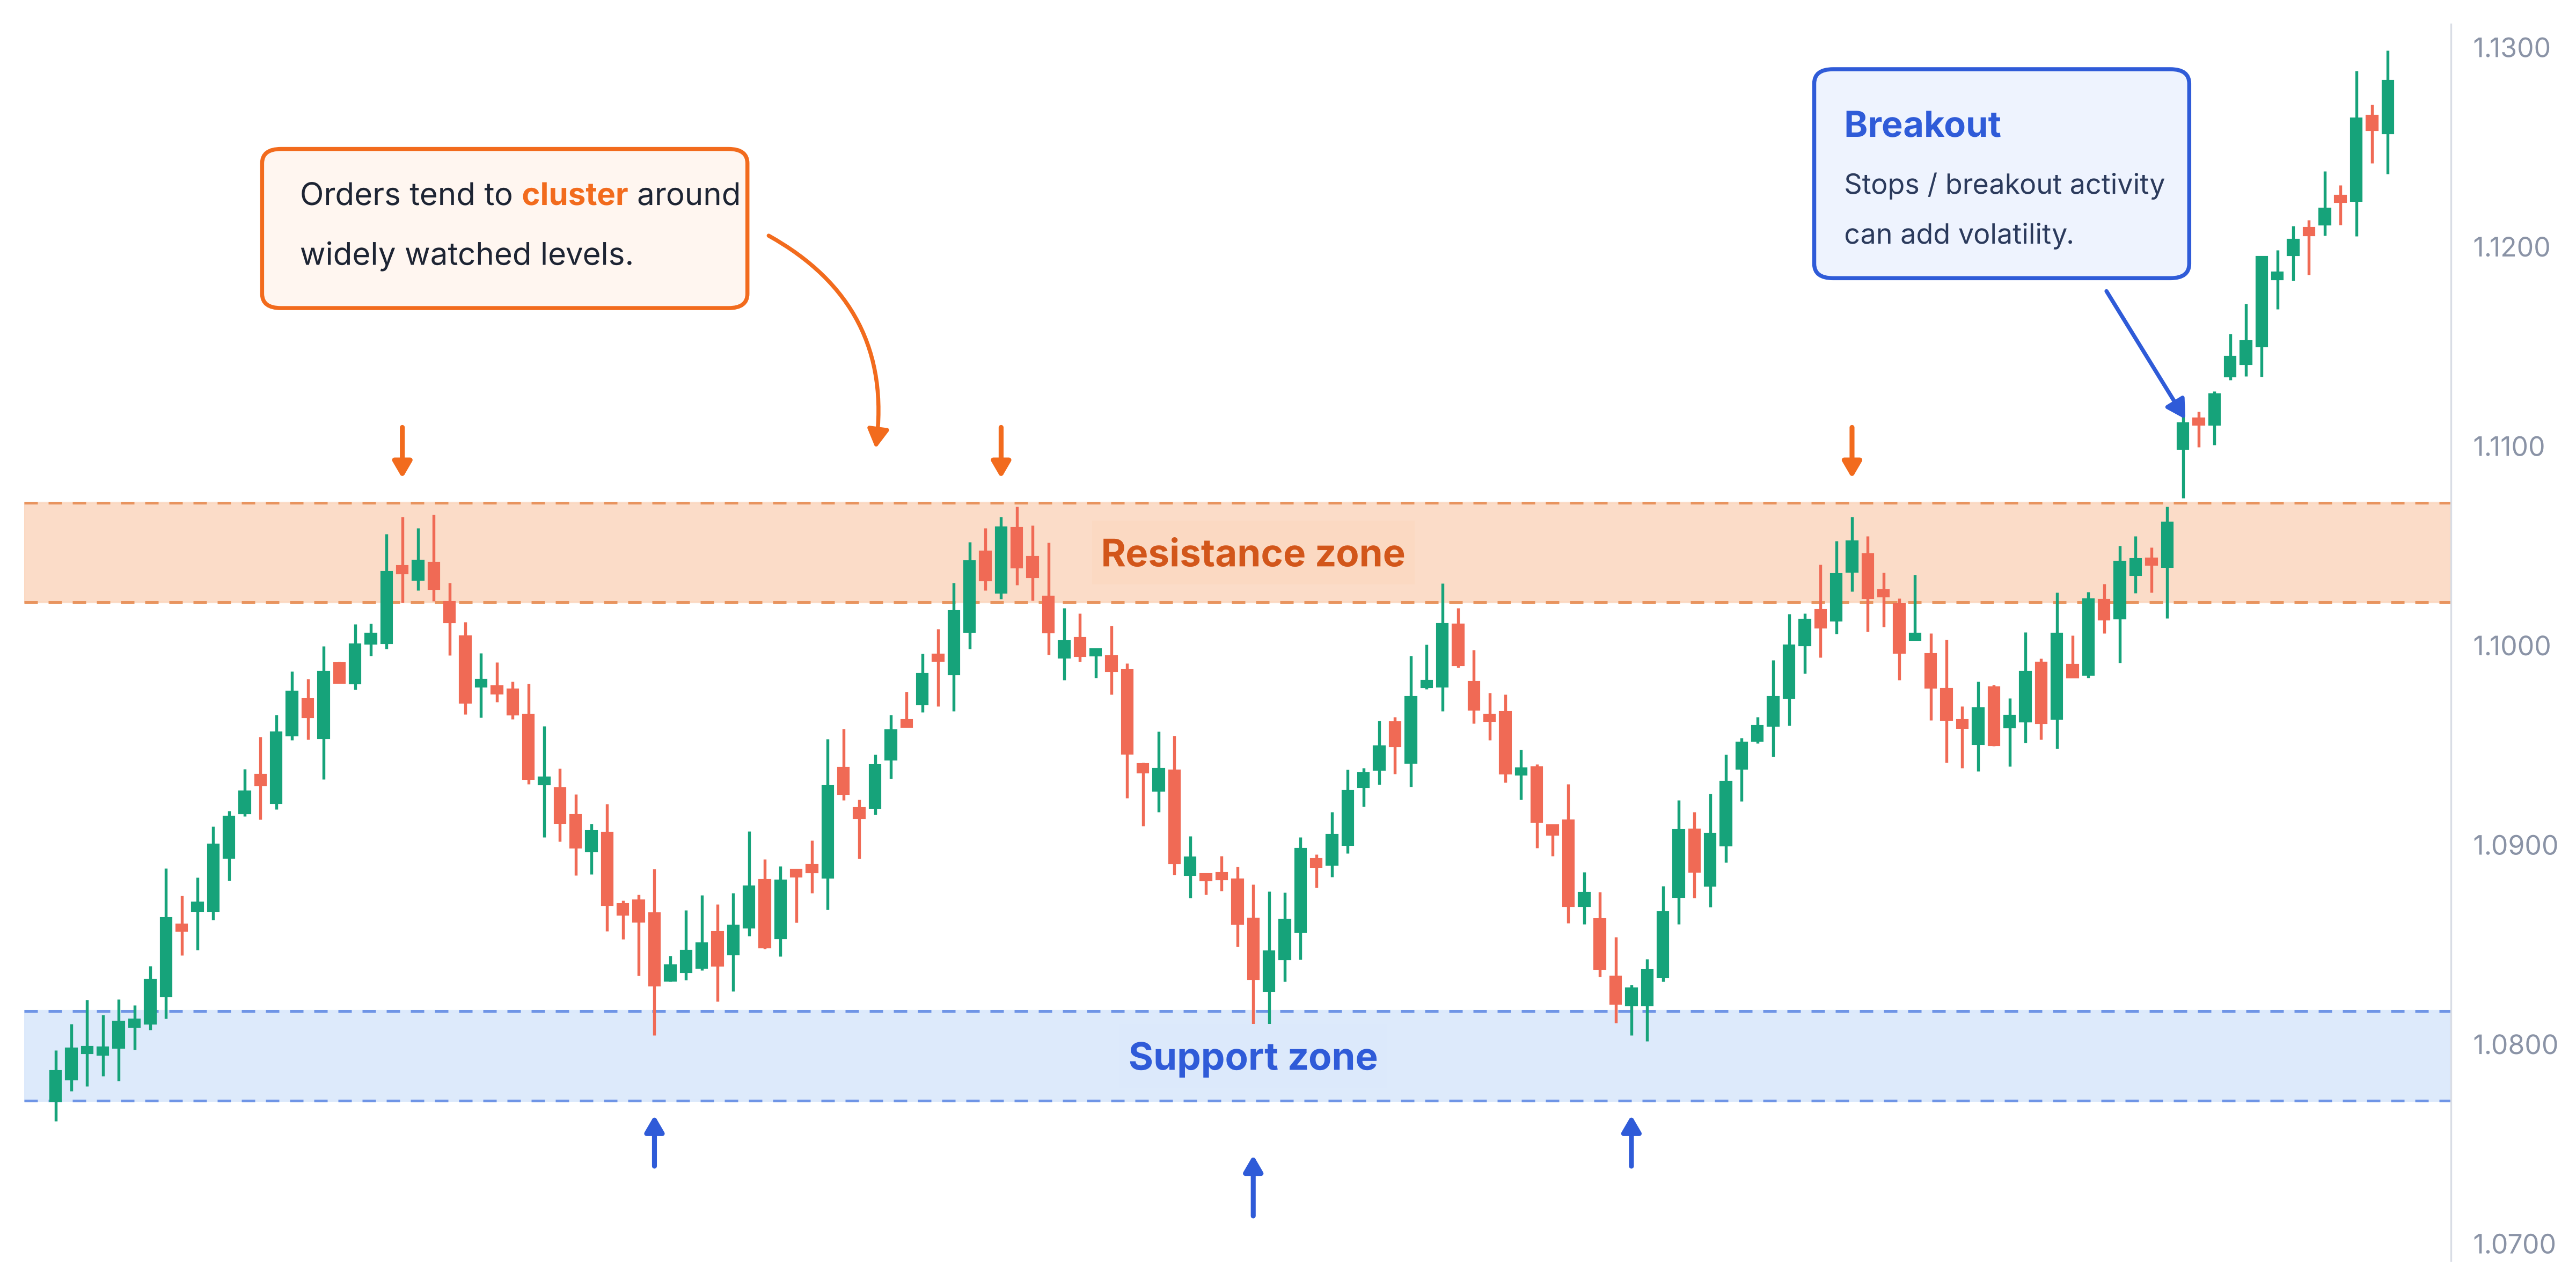
The most widely watched support and resistance levels often share one characteristic: they are easy for many market participants to identify. And once a level becomes widely recognized, different types of trading activity tend to cluster around it.
For example, some traders may take profits as price approaches the area, while others may place new orders around the level. Traders already in the market may position protective stops just beyond it, while breakout-focused participants may become more active if price pushes through. Together, that activity can make a widely watched area increasingly important as the market approaches it.
Along those lines, consider EUR/USD approaching a previous high near 1.1450. Traders holding long positions might take profits as the pair nears that level, while others may view the previous high as resistance and place sell orders nearby. Traders already positioned short may have protective stops above the high, while breakout-focused participants may wait for EUR/USD to move decisively through it.
These participants are acting for different reasons, but their decisions are centered around the same price area. As that activity builds, buying and selling pressure around the level can begin to shift, helping explain why a currency pair may slow, stall, or reverse near support or resistance.
Research on foreign exchange order flow supports this broader idea. Stop-loss and take-profit orders have historically clustered around recognizable prices, particularly round numbers. And if a widely watched level eventually breaks, some of those same orders can contribute to a faster, more volatile move.
Which Forex Levels Tend to Matter Most?
Not every support or resistance area comes from the same source. Some levels are important because they mark where prices previously stalled or reversed, while others matter because they are widely recognized reference points across the market. Previous highs and lows, session boundaries, round numbers, and historically sensitive policy areas are among the most common examples.
Round numbers such as EUR/USD at 1.1400 or USD/JPY at 160.00 stand out because they are easy to remember, communicate, and use when setting targets, hedges, risk limits, and orders. Research into currency-market order flow has also found that orders often cluster around round-number prices. When many participants focus on the same figure, the area can become a natural focal point for trading activity.
Session-based levels serve a similar purpose by giving traders common reference points as activity shifts through Asia, London, and New York. The Asian session, for example, establishes a range before European participation increases, while the London and New York opens bring new groups of market participants into an already established price structure. Several session-related reference points are widely monitored:
- The Asia-session high and low
- Prices around the London open
- Prices around the New York open
- The previous day’s high and low
These areas can help show where buying or selling pressure previously faded, and they often remain relevant as later sessions revisit prices established earlier in the day.
Previous highs and lows can matter for much the same reason. They mark areas where the market previously struggled to continue in one direction, making them obvious reference points when price returns. The more visible the level, the more likely it is to attract attention from traders using different strategies or time horizons.
Policy history can add another layer. In USD/JPY, for example, regions associated with previous government intervention may remain sensitive because traders know policymakers have already shown a willingness to act there. If the pair later approaches one of those areas during another rapid or volatile move, intervention risk can begin to influence positioning and risk management. These regions are better viewed as historically sensitive zones than fixed policy lines.
Why Traders Often Think in Zones, Not Exact Numbers
Support and resistance is usually more useful when viewed as a price zone rather than one exact number. Orders around a widely watched level are rarely concentrated at precisely the same exchange rate. Some may sit just above the level, others just below it, while protective stops are often positioned farther beyond the area.
Consider EUR/USD near 1.1400. Buying and selling interest could be distributed across several nearby prices rather than sitting exclusively at 1.14000. Quotes can also vary slightly across liquidity providers, while bid-ask spreads may widen when market conditions become more volatile.
That means a currency pair can move modestly through a familiar price without necessarily producing a decisive break of the broader support or resistance area. A brief move above 1.1400, for example, carries different information from sustained trading through the entire zone and beyond it.
Thinking in terms of zones gives traders a more realistic way to interpret these areas. The focus shifts from whether one exact price was crossed to how the market behaves across the surrounding region.
Why Volatility Can Increase After Support or Resistance Breaks
Support and resistance can behave very differently once a currency pair moves decisively through a key area. One reason is that stop-loss orders often cluster just beyond levels where traders have entered or defended positions.
Suppose traders buy EUR/USD near support at 1.1300. Many may place protective stops below the support zone, where a further decline would suggest the original setup is no longer holding. If enough traders choose similar locations, a concentration of sell stops can build beneath the area.
Once EUR/USD breaks below support, those stops begin to trigger. A standard stop-loss order becomes a market order when its trigger price is reached, adding fresh selling pressure to a move that is already heading lower.
That process can become self-reinforcing. Triggered stops may push EUR/USD into another pocket of selling, activating additional stops farther down and increasing the speed and volatility of the decline. Research on currency-market order flow has documented this type of cascading behavior.
This helps explain why a currency pair can spend hours testing support or resistance, then move through the area much more quickly once it gives way. Orders around the zone may initially slow the move, while stops positioned beyond it can add momentum after the break.
What to Know About False Breakouts
Not every move through support or resistance develops into a sustained breakout. A currency pair can briefly push beyond a widely watched area, trigger orders positioned on the other side, and then reverse back into its previous range.
Suppose USD/JPY rises through a prior high. Stop-loss orders above that level may begin to trigger, while traders waiting for a breakout may start buying. Together, that activity can create a short burst of upward momentum.
For the move to continue, however, additional buying interest may still need to emerge at the higher prices. If that follow-through fades, sellers may become more active, recent buyers may take profits or exit, and USD/JPY can move back below the level it just crossed.
That is one way a false breakout can develop: the market moves beyond support or resistance but does not sustain trading on the other side. The initial move may be strong enough to trigger nearby orders without producing a lasting shift in the balance between buyers and sellers.
What happens after the break can therefore provide useful context. Sustained trading beyond the zone may suggest greater acceptance of prices that previously produced a reversal, while a quick return to the prior range can point to a weaker or less durable breakout.
How News, Liquidity, and Execution Can Affect Key Levels
Support and resistance levels can behave very differently when new information changes market expectations, liquidity becomes thinner, or volatility picks up.
Major economic releases, central-bank decisions, unexpected policy announcements, and geopolitical developments can all change how traders value a currency. When expectations shift sharply, the resulting flow of buying or selling may overwhelm the orders that had previously helped support or contain price around a technical area. That is one reason some of the strongest breaks in forex occur around major news events.
Liquidity can also influence how easily price moves through a level. When fewer orders are available near the current price, even relatively modest buying or selling pressure can produce larger moves and make support or resistance less stable.
Execution becomes especially important when volatility is elevated or liquidity is thin. A stop price is generally a trigger rather than a guaranteed fill. Once a standard stop-loss order is activated, it becomes a market order and is executed at the next available price. If the market is moving quickly, the eventual fill may occur beyond the trigger price, creating slippage.
Take-profit orders work somewhat differently. A traditional take-profit order is generally a limit order, meaning it seeks execution at the specified price or better. In a fast-moving market, price may reach or move through the target without enough liquidity being available to fill the entire order at that level.
Weekend gaps can create another complication. Economic, political, or geopolitical developments may occur while the forex market is closed. If a currency pair reopens at a substantially different price, there may have been no opportunity to transact at the prices in between. A stop inside that gap could therefore be triggered and filled beyond its original level when trading resumes.
The broader point is that technical levels are influenced by the market environment around them. News can change expectations, liquidity can affect how easily price moves through an area, and higher volatility can make both price behavior and execution less predictable.
Developing a Process for Evaluating Support and Resistance Levels
Evaluating support and resistance involves more than spotting a level on a chart. Traders may also consider why an area could attract attention, how relevant it remains under current market conditions, and what the market does as price approaches, tests, or moves through that zone.
There is no single framework that fits every trader, timeframe, or market environment. But the following considerations offer one practical way to evaluate support and resistance levels more systematically:
- Mark the key areas before the session. Previous highs and lows, session extremes, major round numbers, and other widely watched areas can provide a useful starting point. Identifying those levels in advance can help distinguish areas that were already significant from prices that only appear important after a move has occurred.
- Treat each level as a zone. Support and resistance levels usually represent areas rather than one precise exchange rate. Buying and selling interest may be spread across several nearby prices, so a modest move through one number does not necessarily mean the broader area has broken.
- Consider whether the level remains relevant. Market conditions can change over time. A recent high or low formed under similar conditions may carry different information from one established months earlier, particularly if the economic backdrop, interest-rate outlook, trend, or volatility regime has shifted.
- Consider the broader context around the level. Some price areas attract attention for more than one reason. A previous high that also sits near a major round number, for example, may be watched by different groups of participants for different reasons. When several factors converge around the same area, the level may draw more interest than an isolated price point.
- Evaluate how the market approaches and responds to the area. A gradual move with repeated tests can carry different information from a sudden move driven by economic data or a policy announcement. Once the level is reached, a sharp rejection may indicate strong buying or selling interest, while prolonged trading around the zone can suggest that the earlier imbalance is weakening.
- Evaluate whether a break is brief or sustained. A currency pair can move through support or resistance, trigger nearby stops, and then quickly return to its previous range. By contrast, sustained trading beyond the zone can suggest that the market is becoming more comfortable at prices that previously produced a reversal.
- Think about stop placement in relation to the full zone. Because price can temporarily move through the edge of support or resistance, stops placed just beyond one exact line may leave little room for ordinary market movement. Some traders therefore consider the broader zone, current volatility, and the point at which the original setup would be invalidated. A wider stop can give the trade more room to develop, but it also increases the potential loss, making position sizing an important part of the risk-management process.
- Keep the broader market environment in view. Economic releases, central-bank decisions, intervention risk, changing liquidity, and shifts in volatility can all affect how price behaves around a technical area. Traders may also consider the timing of major scheduled events, since an important data release or policy decision can quickly change market expectations. A level that has held repeatedly under normal conditions may respond very differently when new information changes the balance between buyers and sellers.
Ultimately, support and resistance analysis can be most useful when it is applied as a flexible decision-making framework, rather than a fixed set of rules.
Some traders may place greater weight on session levels, previous highs and lows, or round numbers, while others may focus more heavily on volatility, broader market context, or how price responds around a zone. What’s most important is having a consistent process for identifying relevant areas, evaluating the conditions around them, and adapting that process as market conditions evolve.
Bottom Line
Support and resistance analysis can help traders identify areas where market attention and trading activity are more likely to become concentrated. Previous highs and lows, session levels, round numbers, and other widely watched zones can all serve as useful reference points for understanding where price may slow, reverse, or become more volatile.
Context ultimately determines how much weight to give those areas. Market conditions, the way price approaches a level, the strength of the response, and what happens after a break can all influence how significant that zone remains. Rather than treating support or resistance as a fixed signal, traders can use these levels as reference points within a broader process for evaluating price behavior and market conditions.
How to trade US dollar
- Open an account to get started, or practice on a demo account
- Choose your forex trading platform
- Open, monitor, and close positions on USD pairs
Trading forex requires an account with a forex provider like tastyfx. Many traders also watch major forex pairs like EUR/USD and USD/JPY for potential opportunities based on economic events such as inflation releases or interest rate decisions. Economic events can produce more volatility for forex pairs, which can mean greater potential profits and losses as risks can increase at these times.
You can help develop your forex trading strategies using resources like tastyfx’s YouTube channel. Our curated playlists can help you stay up to date on current markets and understanding key terms. Once your strategy is developed, you can follow the above steps to opening an account and getting started trading forex.
Your profit or loss is calculated according to your full position size. Leverage will magnify both your profits and losses. It’s important to manage your risks carefully as losses can exceed your deposit. Ensure you understand the risks and benefits associated with trading leveraged products before you start trading with them. Trade using money you’re comfortable losing. Past performance is not indicative of future results.
1 The greater foreign exchange marketplace reached $9.6 trillion per day in 2025; however, tastyfx LLC is the counterparty to the FX transactions of its client base and therefore serves as the liquidity provider in this much smaller subsection of this marketplace. Source: Bank for International Settlements Triennial Central Bank Survey (2025).